Persona-based campaigns, retargeting and a dashboard, adjusted from one phase to the next.
Home > Case study: insurance brokerage
This case study describes the performance marketing engagement of an insurance brokerage in Quebec, run in four successive phases over ten months: campaigns designed by persona and by funnel stage, retargeting, landing pages and a dynamic dashboard, to generate qualified leads at a sustainable acquisition cost.
The brokerage wanted to generate qualified leads at a sustainable acquisition cost and, for car insurance, to increase their number. The engagement started with the ecosystem itself: quickly optimizing the ad accounts, checking the quality of campaign tracking, setting the right indicators and putting in place a first version of a real-time dashboard. It is a performance marketing engagement: framing and measurement first, campaigns next. We do not name the client, and we give no detail that would identify it.
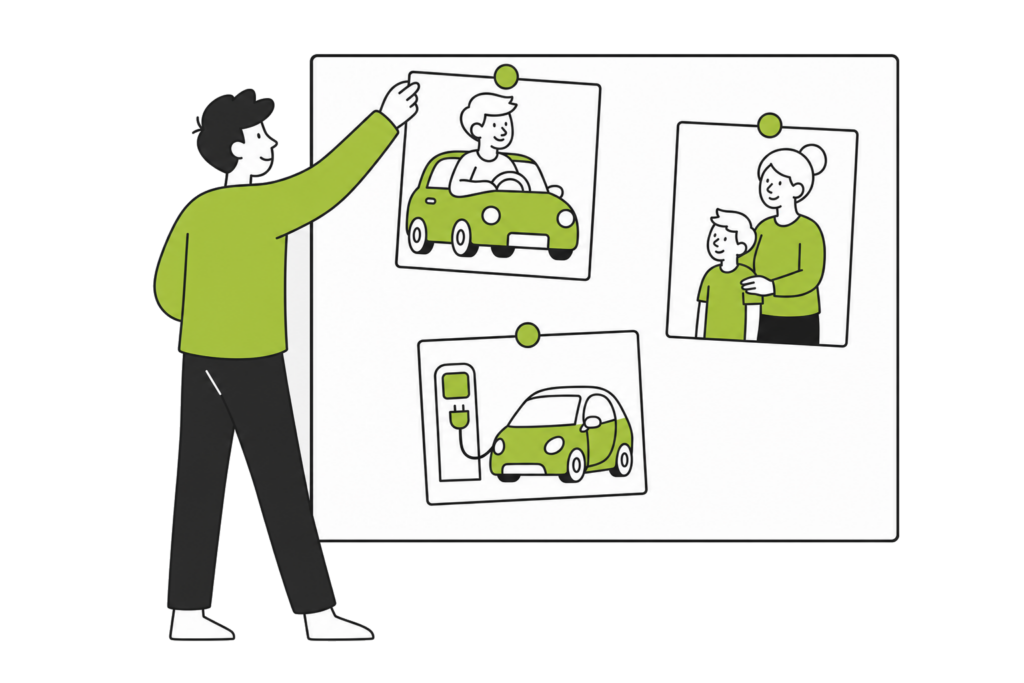
Every campaign was designed before it was built: the customer journey, the media chosen for each stage of the funnel, from top to bottom, the semantic universe and the messages. Audiences were built from the brokerage's personas, locations and services, then turned into campaigns for each medium, with ads in every required format. In the third phase, for car insurance, acquisition was organized by persona, with a conversion funnel for each: young drivers, parents, electric vehicle owners.
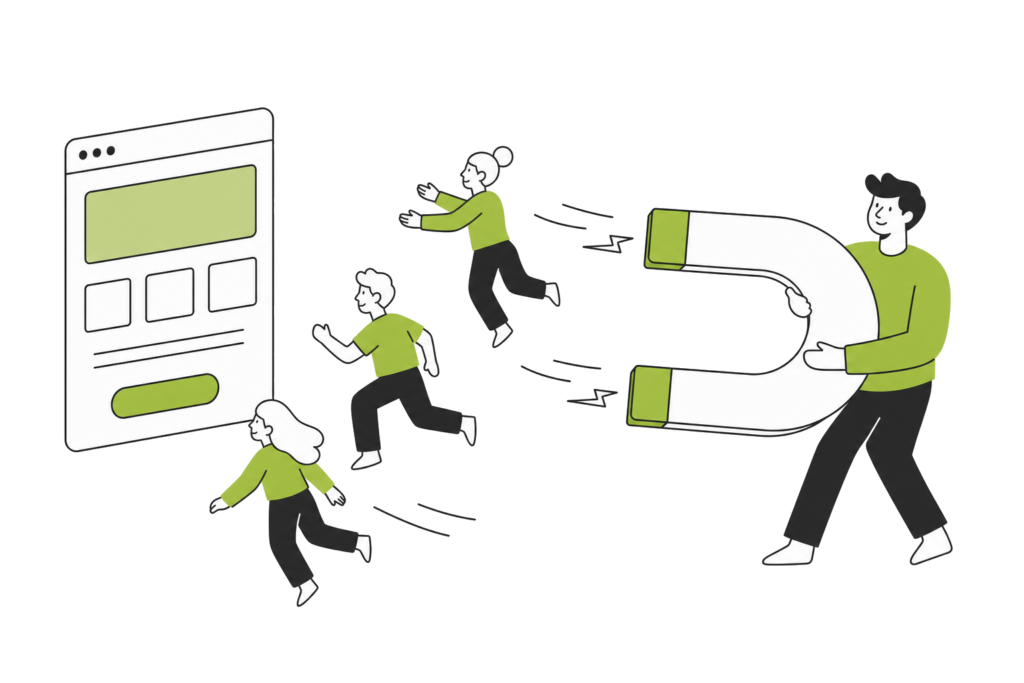
Retargeting was part of the engagement from the first phase: a campaign created for people who had already interacted with the site during the campaign, to convert as many of them as possible. Landing pages were built on Unbounce; for the conversion campaigns, they were created by the brokerage's team under Sekoia's supervision. Consistency between the ad and the page that follows it is what turns a click into a lead, and that is where conversion rate optimization work meets advertising.
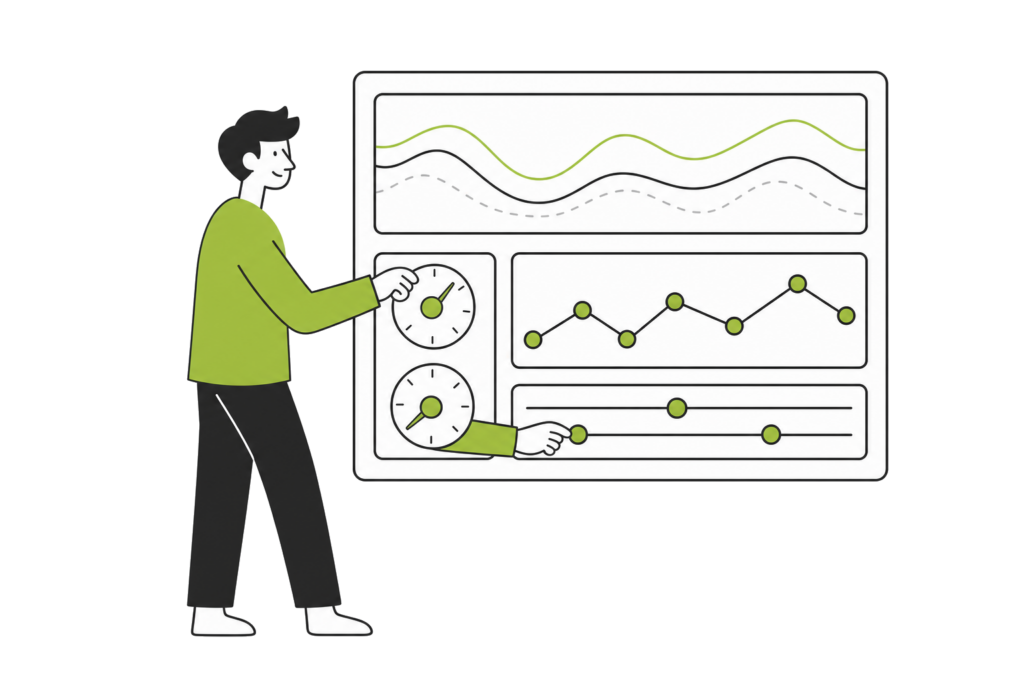
A dynamic dashboard brings together all the campaign tracking indicators. Its first version was delivered in the first phase, a second in the following quarter, and it was updated for the conversion campaigns. Each phase included tracking and optimization for the full duration of the campaigns. We do not publish any figures for this case: the documents it is based on describe the work, not its measured results.
To generate qualified leads at a sustainable acquisition cost. For car insurance, the goal of the conversion campaigns was to increase the number of leads while keeping the acquisition cost as low as possible.
We first put the ecosystem in order: accounts optimized, tracking checked, indicators set, a real-time dashboard. Then we designed and built the campaigns by funnel stage and by persona, the retargeting and the ads in every required format, and we tracked and optimized them for their full duration.
From the brokerage's personas, locations and services. For car insurance, in the third phase, each persona got its own conversion funnel: young drivers, parents and electric vehicle owners.
Because we only publish what we can document with dated original data. The documents this case is based on describe the work done, phase by phase; they contain no measured result. We would rather publish a case without a figure than a figure without proof.
It ran in four successive phases over ten months: the ecosystem in the first month, the campaigns of the following quarter, the conversion campaigns in the third phase, then tracking over the final two months.
Sekoia is a lean growth agency that helps small and medium-sized businesses perform better in highly competitive markets. Pioneers in Generative Engine Optimization (GEO) in Quebec.
COPYRIGHT @ SEKOIA – 2026